

According to Internal Revenue Service (IRS) data, there were 33.9 million interstate moves in the United States for tax years 2018–23. In 2023 alone, 6.7 million Americans packed up and moved across state lines, taking their income, their tax dollars, and their economic gravity with them. Where did all this movement actually take place, and which states gained or lost the most residents?
In a new policy brief I examine the large differences in domestic migration patterns across states between 2018 and 2023 and evaluate a range of possible factors that play a role in those patterns, including tax burden, housing supply, broad economic freedom, labor market freedom, partisan preferences, cost of living, government size, population density, climate, and housing prices. Multiple years of data provide a more reliable picture of migration trends than single-year observations do, while a five-year lookback includes pre-pandemic, pandemic-era, and post-pandemic migration patterns.
The results suggest that over the five-year period, interstate migration in the United States has not been driven primarily by cost of living or climate, as commonly assumed. Instead, the data point to a different conclusion: Americans are systematically moving to states with lower tax burdens, more flexible housing supply, and more economic freedom, suggesting that policy choices play a central role in shaping where people choose to live. States seeking to sustain population growth need to maintain competitive tax structures and allow housing supply to expand in response to demand.
Domestic Migration Patterns Across States
The migration patterns observed during the five-year period between 2018 and 2023 raise important questions about why some states consistently gained residents while others lost them. On net, Florida gained the most movers (+911,422), while California lost the most (−1,263,365).
The data charts below show net migration flows and subsequent income flows for Florida and California. In Florida, 29 percent of the net migration gain was from high earners who made up 79 percent of the total income gain for the state during that 5-year period. For California, about 19 percent of those leaving the state were high earners, but those high earning migrations made up 64 percent of income leaving the state.
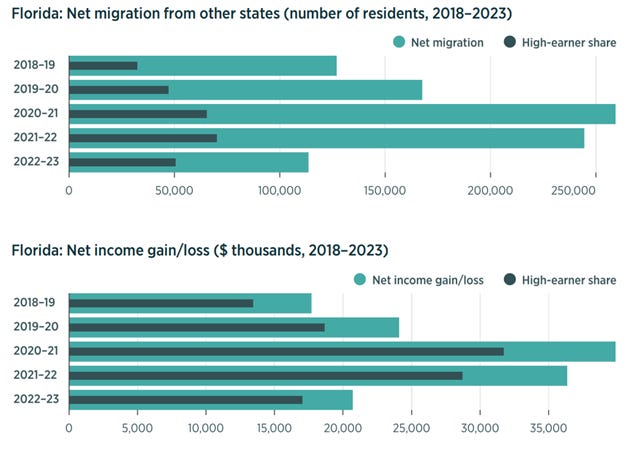
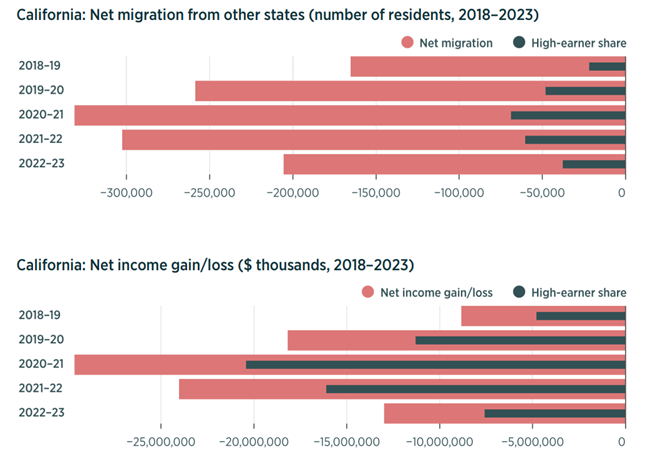
Higher-population states would naturally be expected to lose or gain the most individuals. To account for this, a better way to measure the net movement of people between states is to measure the movement of people as a share of the state population. Figure 2 shows the net migration rate—this is the number of individuals moving per 1,000 residents in the state they are moving to or from.
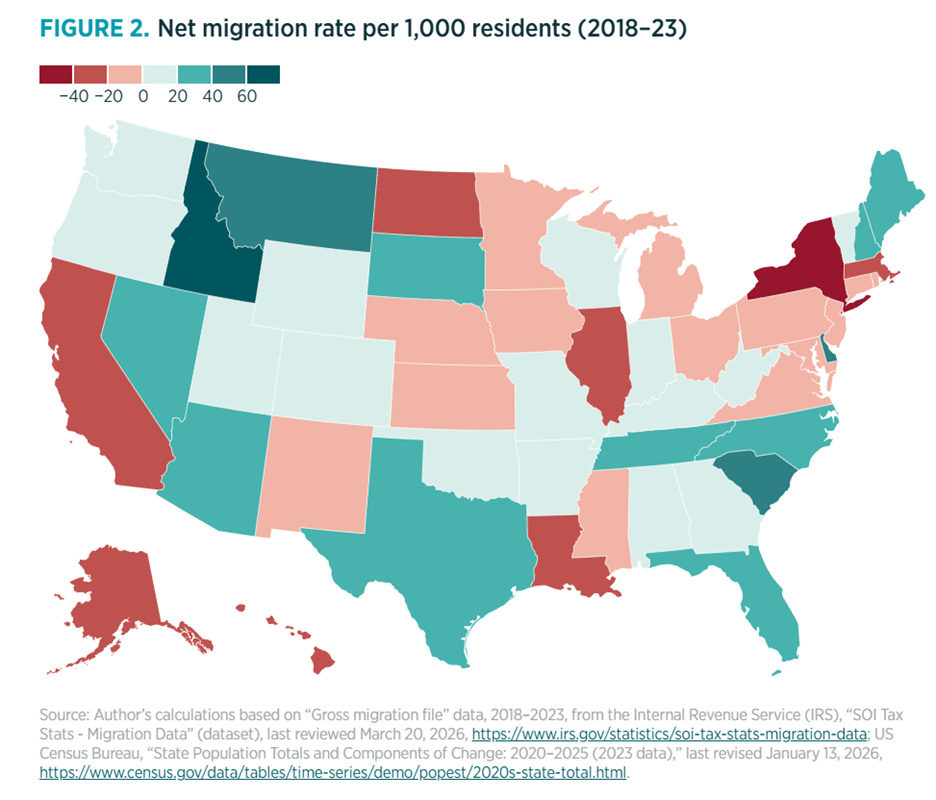
In this case, the states with the highest positive migration rates are Idaho (+63.1), South Carolina (+53.6), Delaware (+42.5), Montana (+42.4), and Florida (+39.7). Meanwhile, the states with the highest negative migration rates are New York (−52.9), Alaska (−37.3), Illinois (−34.0), California (−32.2), and Hawaii (−30.2).
Taken together, these patterns suggest that interstate migration is not occurring randomly or evenly across the country. Some states are consistently attracting new residents, while others are steadily losing population.
Comparing the Correlates of Migration
The standard story is that people leave expensive places such as California or New York and move to cheaper ones in the South and Mountain West. Another explanation is that people are chasing sunshine, too (hence big net gains in the Sunbelt region).
To test this theory, I used state-level net interstate migration data covering all 50 states from 2018 to 2023 and examined a range of possible factors including tax burden, housing supply, broad economic freedom, labor market freedom, partisan preferences, cost of living, government size, population density, climate, and housing prices. Examining each individually and one at a time produces a clear ranking of the factors most strongly associated with interstate migration. These regressions should be interpreted as descriptive rather than causal. Many of these factors are closely related and tend to be jointly determined with migration. The goal is to identify broad patterns rather than isolate precise causal effects.
One important caveat is that the migration data span a period that includes the COVID-19 pandemic and the associated surge in remote work and geographic mobility. These developments likely amplified interstate migration flows. The current analysis, however, compares differences across states rather than changes within states over time. To the extent that the pandemic shock affected states unevenly, those effects are likely captured by the same structural factors examined in this analysis.
Which Factors Matter Most?
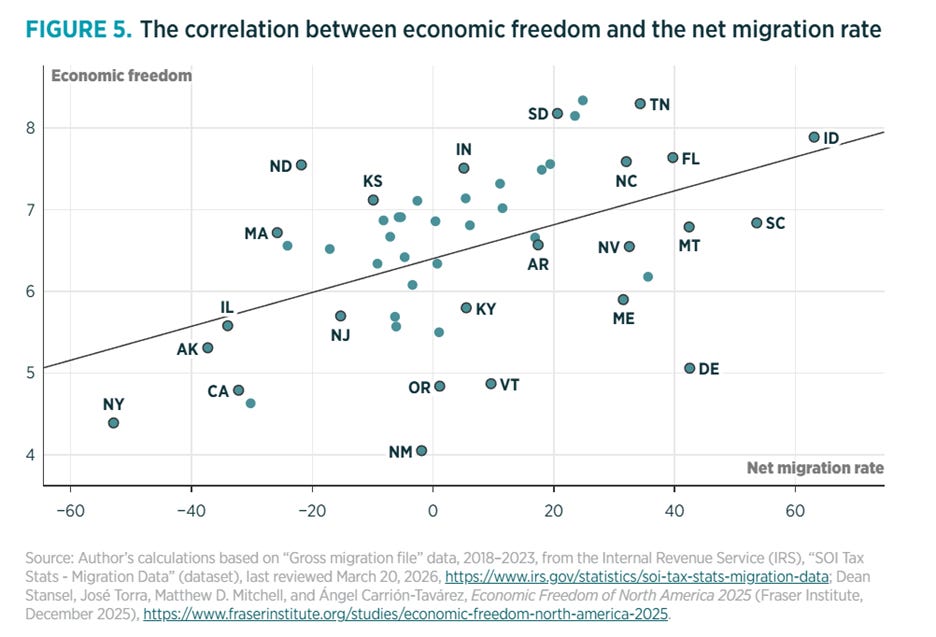
Across all specifications, tax burden is the most powerful and robust predictor of migration. States with lower taxes attract more people. That result holds even when controlling for housing permit issuance rates, climate, population density, and cost of living.
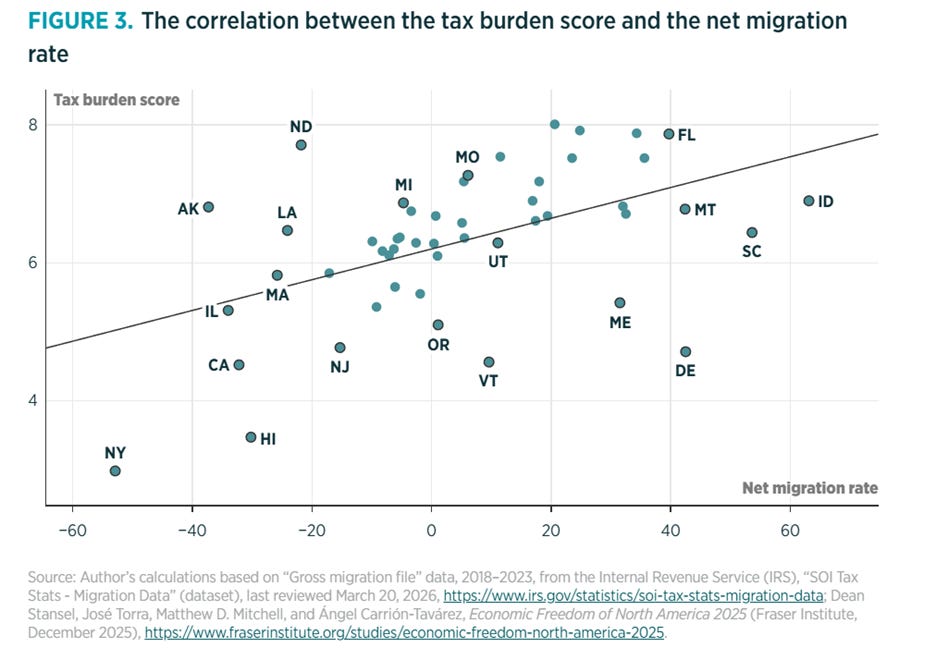
The mechanisms behind this relationship are relatively straightforward. Tax policy directly affects after-tax income. For mobile households, particularly higher earners and business owners, even modest differences in state tax burdens can translate into meaningful differences in take-home pay over time. This creates a persistent incentive to relocate toward lower-tax states, especially when those differences compound year after year. States with larger government sectors tend to experience more out-migration than states with leaner government sectors. The effect of government size, however, is smaller and less robust than that of tax burden. The broader “economic freedom” effect turns out to be largely a tax effect. Once the components are separated, labor market freedom and government size also play a role, albeit a smaller one.
But tax burden is not the whole story. The variable of housing permit rates, which affect housing supply, shows up consistently as well. In the strongest model, permits are not just positive, but statistically significant. Housing supply determines whether a state can accommodate new residents without sharply increasing costs. In states where construction is constrained by zoning rules, permitting delays, or regulatory barriers, increases in demand tend to show up as higher prices rather than more housing. This supply constraint limits in-migration and can push existing residents out. By contrast, states with more flexible housing supply can absorb population inflows more easily, keeping costs lower and enabling continued growth.
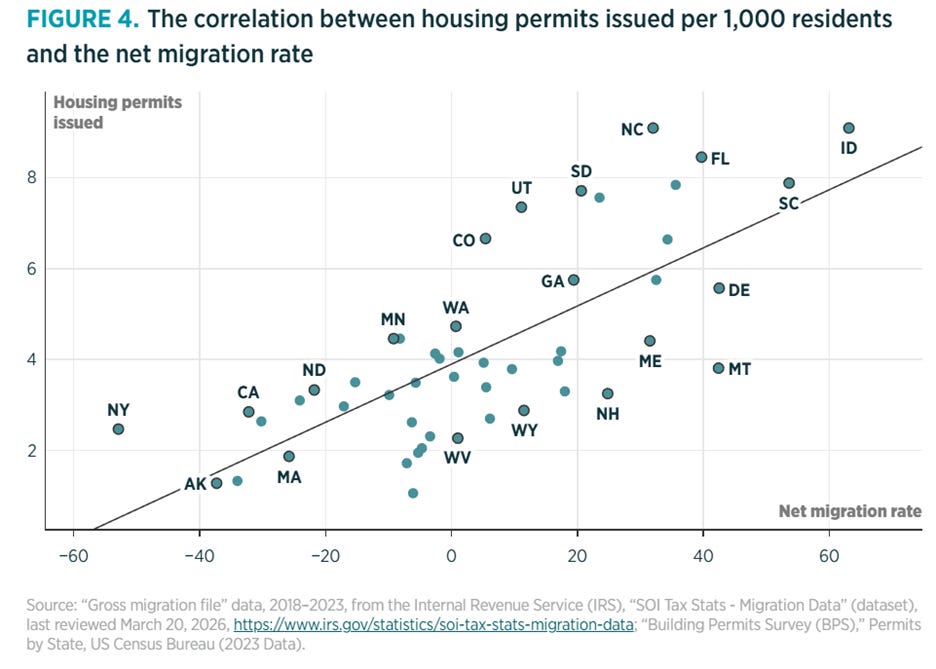
Importantly, housing supply is not independent of the tax burden variable. States with more favorable tax and regulatory environments are also more likely to permit new construction, suggesting these factors reinforce each other rather than operate in isolation. This combination both attracts new residents and sustains those inflows over time.
Cost of living and migration
The relationship among housing supply, tax policy, and migration also helps explain why commonly cited factors such as cost of living or house prices lose significance in the multivariate analysis. High prices are often the result of underlying policy constraints, particularly limited housing supply and higher tax burdens, rather than independent drivers of migration decisions. Cost of living, measured using the BEA’s regional price parity index, is negatively associated with migration, as expected, but the relationship is not statistically significant. The same is true of population density. Even partisan preferences, proxied by 2024 vote margins, have no independent explanatory power.
The migration patterns from 2018 to 2023 are not primarily about sunshine or sticker prices. They reflect something deeper: how states structure their economies. Lower-tax states with more flexible housing supply are gaining population, while higher-tax states with constrained supply are losing it. Everything else—climate, politics, even cost of living—is secondary.
The standard narrative focuses on affordability and climate. But the data point elsewhere: toward tax policy and housing supply. That story is less simple, but it is more accurate and ultimately more useful for understanding where Americans are going and why.
Policy Implications
The results suggest several implications for state policymakers.
First, tax policy plays a central role in shaping migration patterns. States with higher tax burdens risk losing residents, particularly higher-income and more mobile households, to lower-tax jurisdictions. Efforts to raise revenue through higher marginal tax rates may therefore face important tradeoffs, including the gradual erosion of the tax base over time.
Second, housing supply constraints significantly limit a state’s ability to attract and retain residents. Restrictive zoning laws, lengthy permitting processes, and other regulatory barriers not only raise housing costs, but also reduce in-migration by preventing supply from responding to demand. States that want to accommodate population growth must ensure that housing markets can expand accordingly.
More broadly, the findings suggest that attracting and retaining residents depends less on geographic advantages than on policy choices. States that prioritize competitive tax structures and allow housing supply to respond to demand are more likely to experience sustained population growth.
Great to see an analysis of what is deeply felt here in the Democrat controlled tyranny of California.
To improve your model, supply and demand would better "identify" supply and demand factors by simultaneous-equations (a supply and demand equation), each with the candidates exogenous factors (determined outside the model) distinct to endogenous demand or to supply (could proxy by in- and out-migration). For example, high-tax, high amenities California, one of the highest demand states ("wouldn't consider living anyplace else") see more outmigration that arrivals (though such "churning" among the highest) because of high costs, taxes, and congestions, from folks who want to live there more; similarly, low-tax Florida, low-public services (with high in-migration has among the highest "flight rates", too, but just not as many). Such a model could then distinguish between the heavy migrations in and out versus states with few moving van traffic, like Maine, W. Virginia, Kansas, and Delaware (which neither attract nor drive out many residents).
One major limiting factor with relying on STATE DATA though (rather than superior Metropolitan Area data) is lack of homogeneity (averages or totals don't represent the bimodality of urban-rural regions); most states have stark divergence between MSA or LMSA job and markets, entrepreneurial opportunities, and amenities versus in medium/small cities and rural; even in (especially in high migration Texas, Calif, Florida, Pennsylvania, New York, Missouri, Illinois, Ohio, Michigan). In addition, be sure to use WEIGHTED REGRESSION (weight by population) due to the 100 to 1 ratios between largest and smallest states, otherwise Wyoming, VT, AK, SD migration way overrepresent results, and CA, TX, FL way underwt'd.
Also, a time series context is important. This century has seen very low rates of interstate migration, marked by notable exceptions such as the mass departure for Louisiana after Katrina, reversal of outmigration states after the Fracking boom in the Dakotas and upper Midwest all the way east to northern PA (N. Dakota went from fastest shrinking among fast pctg. growth).