
Introducing the Free to Give Index: Grading Every State on Philanthropic Freedom

This week, Philanthropy Roundtable published the Free to Give Index, a comprehensive, state-by-state assessment of the policy environments that shape charitable giving and nonprofit activity across the United States. The Fraser Institutes Matthew Mitchell and I coauthored the project together. The Index draws on 33 distinct variables to evaluate how well each state’s laws, tax policies, and regulations support, or hinder, a vibrant philanthropic sector.
What We Measured
The Index is organized into three subindices, each capturing a different dimension of philanthropic policy.
The first, the Broad Policy Environment, examines the general economic conditions that power private giving. Philanthropy doesn’t emerge from a vacuum; it depends on a thriving private economy. When states pile on taxes, licensing burdens, and regulatory complexity, they shrink the pool of private capital available for charitable purposes. Prior research has consistently shown that people in economically freer states are more philanthropic. Our index takes that finding seriously.
The second subindex, Nonprofit Freedom, drills into the regulations specific to nonprofits: how easy is it to start a charity? What reporting requirements must organizations meet? How are paid solicitors regulated, and what compliance burdens do charities face? Standard economics predicts that higher barriers to entry and operation mean less charitable activity, and that dollars spent on compliance are dollars not spent on mission.
The third subindex, Donor Confidence, examines the rules that shape donors’ decisions: How does the state tax charitable contributions? Does it protect donor privacy? Can donors trust that their intent will be honored? How are donor-advised funds regulated? These factors affect not just whether people give, but how much, and how confidently.
What We Found
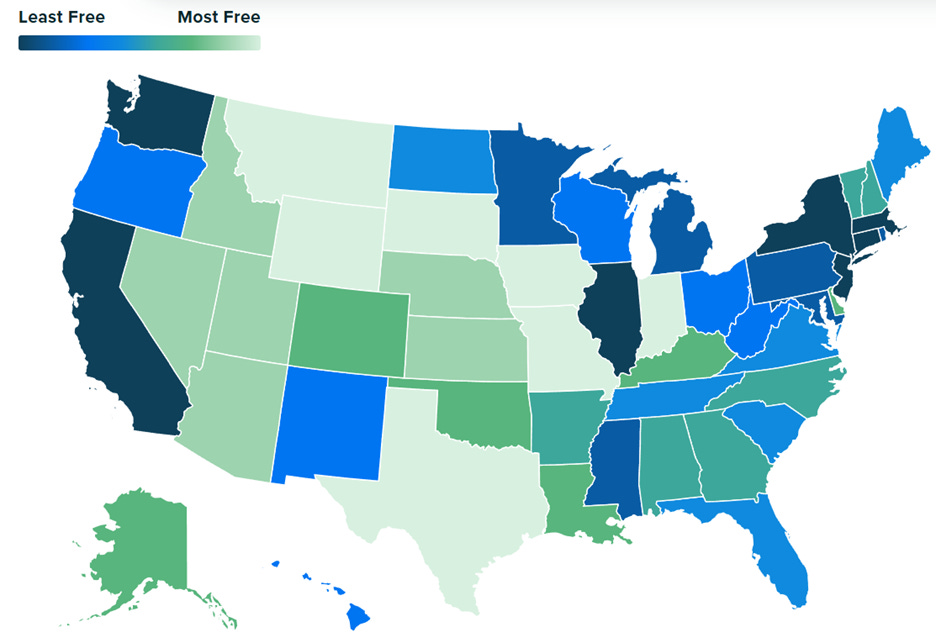
The differences between states are striking. Montana, Wyoming, South Dakota, Iowa, and Indiana rank as the five most philanthropy-friendly states in 2025. They combine economic openness, streamlined charity regulations, and strong protections for donor rights. At the other end, Connecticut, New York, Washington, New Jersey, and California impose the heaviest burdens, complex regulatory frameworks, weaker donor safeguards, and structural disincentives to giving.
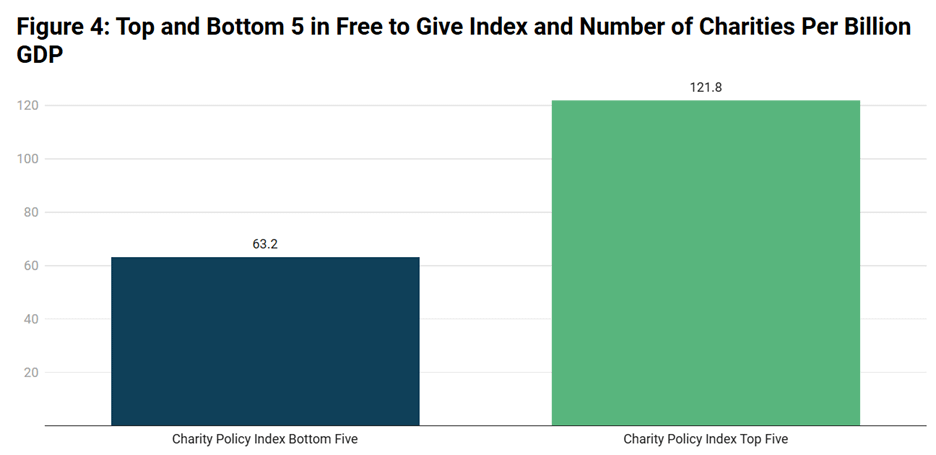
The practical consequences are visible in the data. We measured charitable activity by counting the number of nonprofit organizations per billion dollars of GDP—a metric that adjusts for differences in state economic size.
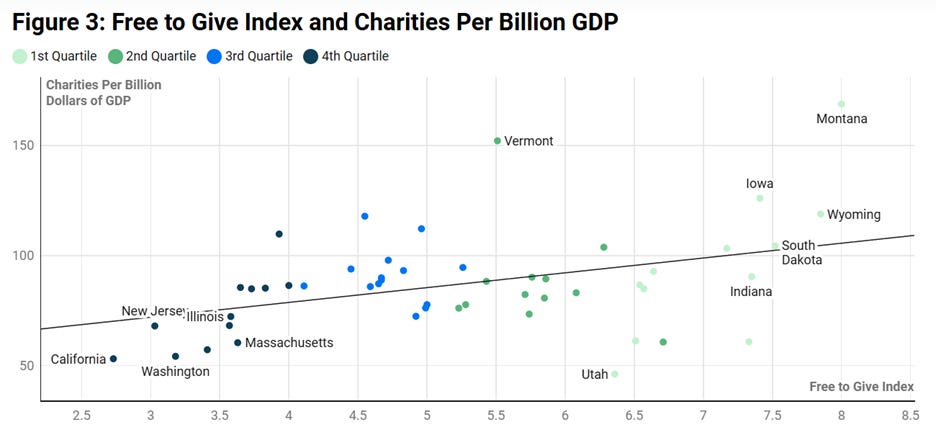
The results are telling: among the five lowest-ranked states, there are an average of 63 charities per billion dollars of GDP. Among the top five, there are 122. That’s nearly twice as many charities per unit of economic output.
A one-point improvement in the Free to Give Index, roughly the difference between Nebraska and South Dakota, is associated with seven additional charities per billion dollars of GDP. While this analysis doesn’t establish causation, it’s a robust correlation that echoes earlier research: burdensome regulation suppresses the formation and growth of charitable organizations.
Why This Matters
Philanthropy flourishes when citizens are free to organize, give, and serve their communities without unnecessary government interference. Yet in too many states, charities and donors face layers of red tape that make it harder to form new organizations, raise funds, and direct resources where they are needed most. Every hour spent navigating duplicative filings, costly registration rules, or intrusive disclosure requirements is time and money diverted away from feeding families, housing the homeless, educating children, and strengthening civil society.
The Free to Give Index is designed to make those barriers visible. By benchmarking every state on the same consistent set of indicators, we give policymakers, researchers, and philanthropic leaders a tool to ask sharper questions: Is our regulatory framework protecting the freedom to give, or discouraging charitable entrepreneurship? Are state policies empowering donors and nonprofits, or imposing costs that ultimately weaken the communities they are meant to serve?
This is the inaugural edition of the Index, establishing a 2025 baseline. Future editions will track changes over time, allowing us to measure the effects of specific policy reforms as they unfold. As states experiment, loosening licensing requirements, reforming solicitation rules, strengthening donor intent protections, we’ll be watching and measuring.
America’s charitable tradition is a national asset. The Free to Give report is our effort to protect and strengthen it, one data point at a time.
The devil's advocate in me wonders if your "robust correlation" isn't being treated as causation in the wrong direction:
"burdensome regulation suppresses the formation and growth of charitable organizations."
What if those 5 states impose all that regulation because the people in those states are too stingy and the state apparatus has to step in to fill in for the market failure?