
The Quarterly Ledger: A Review of the Nation’s Balance Sheet: Q2 FY2025


With the House of Representatives’ recent approval of the $5.8 trillion Senate budget resolution, it would be valuable for policymakers to take stock of the nation’s balance sheet. Six months into Fiscal Year 2025, the debt held by the public is $28.96 trillion. This is an increase of $1.45 trillion from the same time last year, or an increase of roughly $9,400 per federal taxpayer.
As a share of gross domestic product (GDP), the public debt ratio is 97.4%. The public debt ratio is on track to reach the second highest level on record in 2025 (the highest level was in 1946 at 106%), and the Congressional Budget Office (CBO) forecasts our debt trajectory will reach a record high within the next four years.
At this level of public debt, the U.S. economy forgoes about 0.5 percentage points in potential economic growth based on the median of 53 estimates in the empirical literature. In other words, real economic growth in 2025 would be about 2.2% rather than the forecasted 1.7% if our debt ratio was stable at 80% of GDP.
Halfway through the fiscal year, the federal government has spent a total of $3.57 trillion, while bringing in a total of $2.26 trillion in receipts, according to the latest Monthly Treasury Statement. Federal revenues are slightly higher than in prior years, but spending is significantly higher than in prior years. As a result, the budget deficit for the first six months of FY 2025 already exceeds $1.3 trillion. As figure 1 shows, this six-month budget deficit is notably larger than in prior years.

Interest Rates and Interest Payments
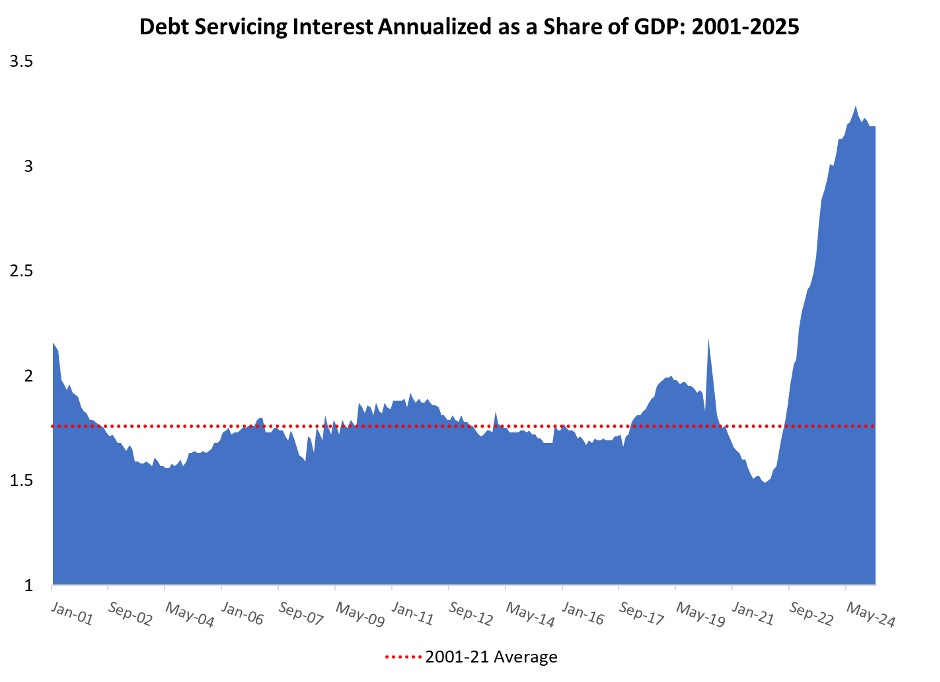
One major federal outlay that has played a key role in driving spending levels higher in recent years is the growing burden of federal interest payments on the debt. Over the past 12 months, the average interest rate on U.S. government debt as a share of GDP has hovered around 3.2%. This is significantly higher than the 2000-2021 average of 1.76%. As both the public debt ratio and the interest rate on U.S. Treasuries move higher, interest expenses crowd out a larger share of the federal budget, leaving less revenue to be distributed to other policy goals and programs. More than this, the larger budget deficit also crowds out economic growth by reducing private savings and investment.
As interest rates and subsequent interest payments continue on an upward trajectory, a larger share of federal revenue is spent on servicing the debt. Figure 3 below shows that year-to-date almost 22 cents in every dollar of tax revenues collected was spent on servicing the debt. This is up from 18 cents in 2024, 15 cents in 2023, and 11 cents in 2022. In other words, we’re currently spending about twice the share of tax revenue on servicing the public debt than we were less than three years ago.

Maturity Structure of Public Debt
The maturity structure of public debt is a critical indicator of fiscal risk, revealing how soon the government must refinance its obligations and how vulnerable it is to changes in interest rates. The U.S. debt maturity structure is relatively short-term, meaning most of the debt is regularly rolled over into short-to-medium-term Treasuries. Figure 4 below shows the average maturity of public debt over time since 2000. This data is sourced from the latest Quarterly Refunding Documents (Treasury Dept). Historically, the average maturity of U.S. public debt is 64 months, or roughly 5 years, fluctuating between a low of 49 months and a high of 75 months. Looking at the most recent quarterly data (January-March), the average debt maturity is 71 months, or just under 6 years—this is unchanged from the last quarter.

Looking at the distribution of public debt by different maturities, we can see that 34% of all public debt matures within one year or less, while another 35% matures within one to five years. Figure 5 below reveals that the debt maturity distribution has changed very little over time, with about 70% of debt maturing within five years consistently over time. The share of public debt with a maturity of more than ten years has increased slightly, while the share with a maturity between five and ten years has decreased slightly over time.
Using the latest data from the Monthly Statement of the Public Debt (MSPD), we can see that in the coming quarter (April-June), the Treasury will roll over a little more than $5.2 trillion in maturing treasuries, or roughly 18% of all public debt. The fact that almost one-fifth of the entire debt stock gets rolled over in a single quarter demonstrates just how short-term the maturity structure of U.S. public debt is. This is why rapid and persistent increases in interest rates can have serious adverse consequences to federal budget sustainability—a risk that becomes more significant as the debt stock continues to grow.

Who Holds Public Debt?
Understanding who holds the U.S. public debt reveals not only the financial structure behind government borrowing but also the potential economic and geopolitical vulnerabilities tied to our fiscal position. The data is available in the latest Treasury Bulletin (Table OFS-2). Up through the Great Financial Crisis, the dominant purchaser of U.S. treasuries was foreign investors (foreign governments, central banks, and foreign financial institutions). Between 2008 and 2015 about half of U.S. public debt was held by these foreign investors. However, for the past decade, the share of public debt held by foreign investors has been in decline, with foreign investors now holding less than 30% of public debt. Figure 6 below shows the change in who holds U.S. public debt over the past 25 years, with the three largest purchasers.

As of the latest Treasury bulletin data (March report), foreign investors hold just under 30% of U.S. public debt. Other major holders include the Federal Reserve with 15%, mutual funds with 14%, while state and local governments and depository institutions both hold 6% respectively. The pie chart (figure 7) below breaks down the holdings of U.S. public debt.

The U.S. Balance Sheet is Structurally Vulnerable
As Fiscal Year 2025 reaches its midpoint, the federal government finds itself navigating a precarious fiscal landscape—marked by historically high debt levels, growing interest costs, and a heavy reliance on short-term refinancing. While revenues have improved modestly, they remain insufficient to close the widening gap between spending and receipts. With nearly one-fifth of public debt maturing in the next quarter alone, and interest payments claiming a growing share of the federal budget, the structural vulnerabilities of the U.S. balance sheet are becoming more difficult to ignore.
To monitor the fiscal outlook in real time, I’ll be updating The Quarterly Ledger series every quarter. Each edition will track key changes in the federal balance sheet, including public debt levels, budget deficits, interest payments, and different measures of sustainability. Follow along for ongoing analysis and data-driven insights into the nation’s evolving fiscal position.