
The September Jobs Report That Never Was
How We Measure Employment in America


This is Part I of our two-part series, where we discuss BLS methodology, benchmark revisions, and the state of employment statistics.
We had planned to discuss the September jobs report, but as many of you know, the ongoing government shutdown prevented BLS from releasing its report as planned. Instead, this gave us an opportunity to dive deeper into something more fundamental: how economists measure employment in the United States, why the current system is under scrutiny, and what we can do to restore trust in these critical statistics.
In Brief:
The BLS’s delayed September report offers a window into how U.S. employment data are produced—and why confidence in them has eroded.
Recent benchmark revisions show the U.S. added about 900,000 fewer jobs than first reported, exposing systematic weaknesses in data collection.
Declining survey participation and outdated statistical models—not political bias—drive most of the errors in job estimates.
The BLS remains far more accurate than private-sector alternatives like ADP, despite falling response rates.
Simple procedural improvements—quarterly benchmarking, refined imputations, and greater transparency—could substantially improve accuracy.
Restoring public trust in labor data depends on practical reforms, not structural overhauls.
Signs of Weakness
From a high level, we’ve been seeing increasing signs of a weakening labor market. Unemployment crept up to 4.3% in August, after fluctuating between 4 and 4.2% for more than a year. According to ADP Research, a private firm that provides economic data in parallel to the government statistics, September payrolls declined by 32,000 (though ADP numbers tend to be more volatile). The consensus forecast from economists was around 50,000 new jobs for September—so a negative number or one closer to zero would certainly be disappointing.
Beyond the headline unemployment rate, there are deeper signs of slack. The number of people not in the labor force but who indicate they want a job has surged from 5.48 million at the start of the year to 6.35 million in August—almost 900,000 people in just seven months. This signals hidden labor market weakness among those who haven’t actively looked for work in the past four weeks.
Another troubling indicator: the number of job openings fell below the number of unemployed in July, and the gap has widened since.
Then came the bombshell. On September 9, BLS released preliminary revisions showing the economy added 911,000 fewer jobs than initially estimated for the year through March. If these revisions hold, average monthly job creation would be about half of what we initially thought—71,000 rather than 147,000.
The most likely culprits? Weaker than inferred job creation at new businesses and sampling errors caused by declining survey response rates. One economist noted that roughly two-thirds of the downward benchmark revision appears to stem from faulty business creation counts.
A Crisis of Confidence
This is an unusual moment for labor economists. The BLS jobs report used to be the kind of thing you’d never discuss at a party or family brunch. Now your uncle corners you: “Don’t you work on this stuff?” President Truman famously complained, “Give me a one-handed economist! All my economists say, “On the one hand... on the other hand…’” These days, we find ourselves cast as the “but on the slightly positive side” economists in the dismal science.
So here’s our silver lining. Unprecedented public interest in how BLS collects, compiles, and reports employment data creates an opening. Yes, there’s confusion and skepticism. But confusion is teachable. This is our chance to explain how the machinery actually works and to identify straightforward fixes that could restore confidence.
Start with what happened this summer. On August 1, the BLS released the July jobs report showing 73,000 new nonfarm payrolls. Within hours, President Trump fired the BLS commissioner. The trigger wasn’t July’s modest number; it was the substantial downward revisions to prior months buried in the same release. May collapsed from 144,000 down to 19,000; June fell from 147,000 to just 14,000.
Then came the twist. The September 5 release, after the Commissioner’s firing, revised June down again, from +14,000 to –13,000. Not weak job growth, actual losses. The institutional machinery kept running anyway. Career staff applied the standard revision process, indifferent to political pressure or leadership changes.
The broader timeline is equally revealing. President Trump voiced concerns that the BLS numbers were artificially boosting VP Harris before the election. But consider what the benchmark revision actually showed. On August 21, 2024—before the election—the BLS announced a preliminary downward revision of 818,000 fewer jobs for the Biden-era period from April 2023 through March 2024. Then, on February 7, 2025, after President Trump took office, the final revision reduced that number to 589,000 fewer jobs.
In other words, the preliminary data released during the Biden administration made that period look worse, and the final revision released under Trump made it look less bad. If anything, the timeline cuts against claims of partisan manipulation. The real problem isn’t bias; it’s something deeper about how we measure employment in the first place and why our measurement system keeps missing by such large margins.
How the Sausage Gets Made
Why BLS Jobs Numbers Keep Changing: A Visual Guide
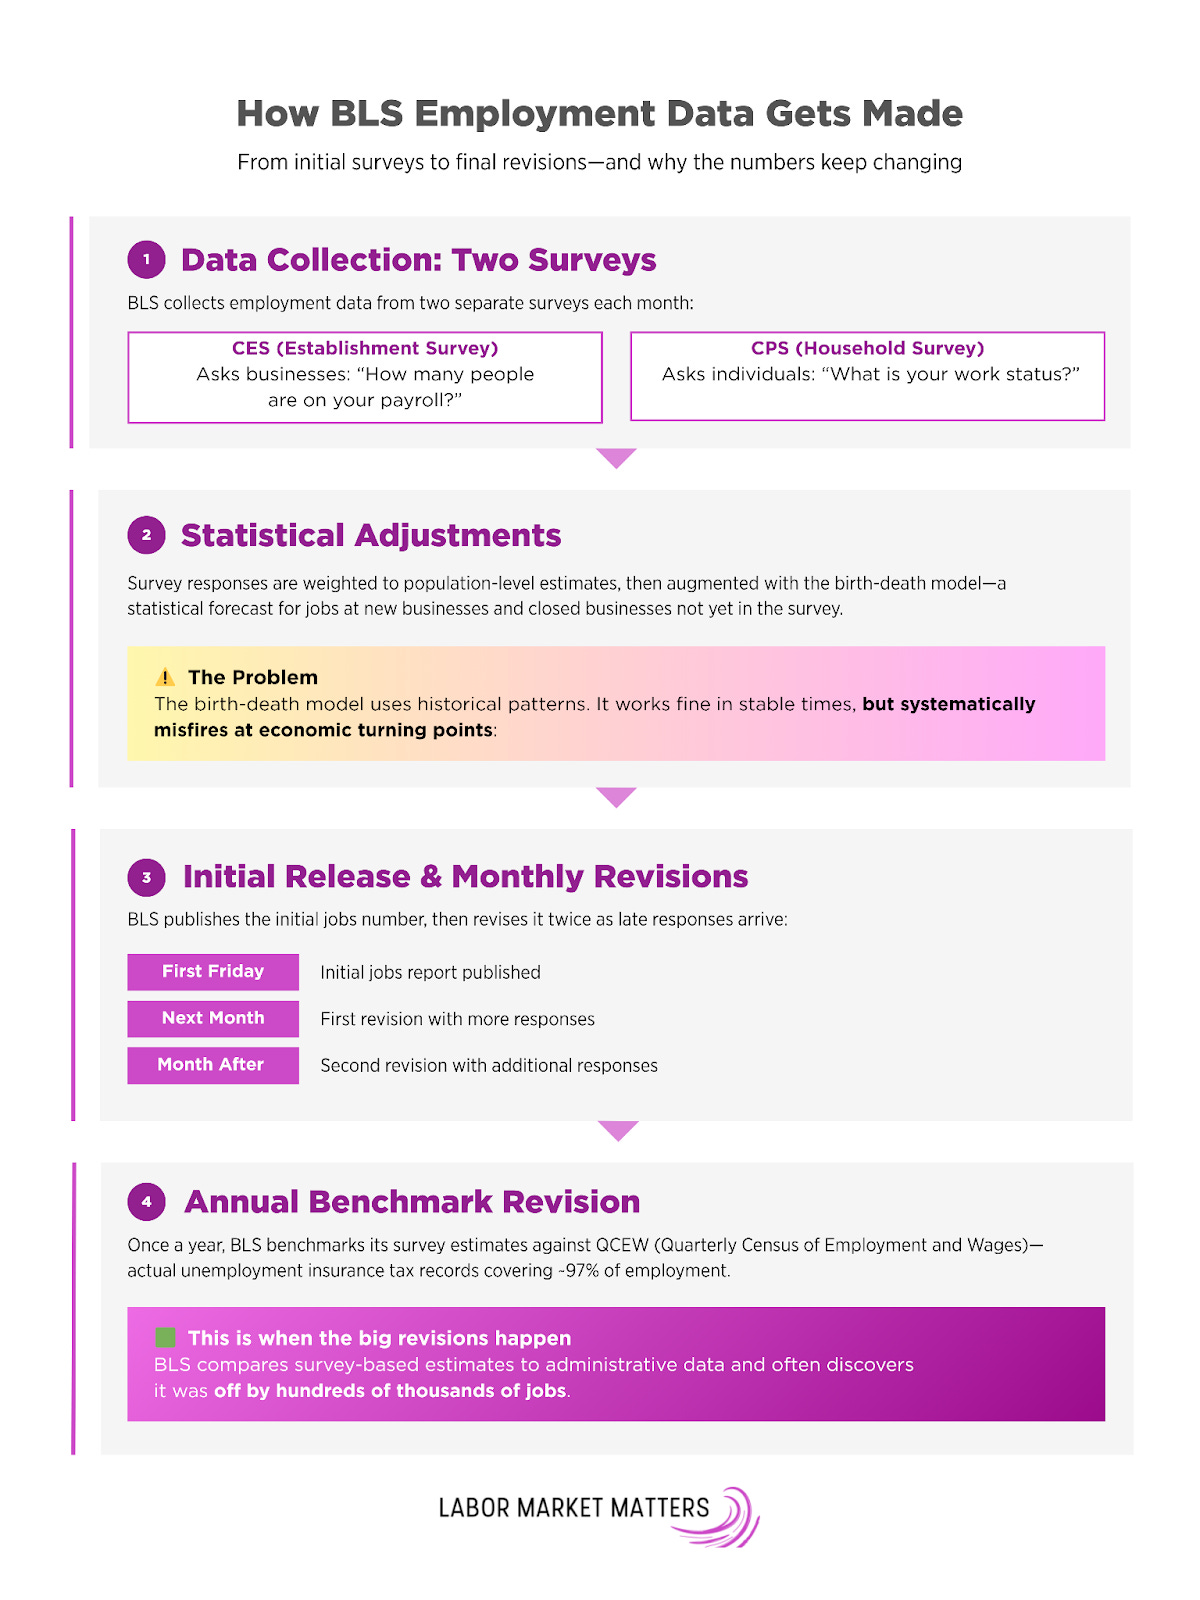
To understand why the revisions are so large, you need to understand where this data comes from in the first place. The BLS Employment Situation report aggregates two separate surveys:
The CES (establishment survey) samples worksites—businesses answer “how many people are on your payroll?”
The CPS (household survey) samples households—individuals answer questions about their work status.
Survey responses get weighted to population-level estimates, then augmented with something called birth-death model imputations. This is where things get tricky. The birth-death model is a statistical forecast that estimates jobs created by brand-new businesses not yet captured in the survey sample, plus jobs lost from businesses that closed before the BLS knew they existed. There’s always a lag between when a company opens or shuts down and when it appears in the BLS sampling frame.
The model relies on historical patterns of business formations and closures by industry. That works fine in stable times. But it systematically misfires at economic turning points. When the economy cools, the model overestimates job growth. It assumes startups that aren’t actually happening. When the economy rebounds, it underestimates growth. It misses surges in new firm formation. This is a major source of those massive benchmark revisions.
The initial monthly number gets revised twice as late survey responses trickle in. Then, once a year, comes the benchmark calibration to QCEW (Quarterly Census of Employment and Wages) administrative records. QCEW is essentially the near-universe of unemployment insurance tax records, covering roughly 95% of in-scope employment. This is when the BLS compares its survey-based estimates to actual administrative data and discovers it was off by hundreds of thousands of jobs. That’s the benchmark revision that generates headlines and fuels suspicion.
The Accuracy Question
The BLS surveys 121,000 businesses each month and asks them how many people they employed in the week including the 12th day. Employment attrition between these weeks means total accuracy is impossible.
Declining survey participation is one real concern. Before the COVID-19 pandemic, about 60% of businesses responded to the CES survey. In recent years, this has dropped to closer to 40%. But even with this decline, the estimates remain accurate. The June revision that initially upset the President was a correction of just a 0.16% error in employment numbers, not a huge miss in the grand scheme of things.
Some critics have suggested that private organizations might be better placed to estimate these numbers. We already have monthly jobs data from a private payroll company, ADP. But while BLS typically has an error rate between 0.1% and 1%, ADP has a median error rate of about 9%—that’s typically about 30 times as inaccurate as BLS data when measured against actual QCEW counts. Private payroll data doesn’t seem like a viable alternative if what we’re seeking is better accuracy and reliability.
Solutions: Low-Hanging Fruit
Here’s the good news. None of these solutions requires reinventing how we measure employment. They’re improvements to existing infrastructure. Some are purely procedural, while others would need additional resources, but none would require starting over from scratch.
Here’s what we can do:
More frequent benchmarking – move from annual to quarterly QCEW reconciliation
Better imputation methods – use small-domain estimation instead of similar industry coarse size classes
Birth-death model transparency – publish a companion series without the forecast
Start with more frequent benchmarking. Right now, the jobs number benchmarks annually with QCEW, but QCEW data is available quarterly. Move to quarterly benchmarking and you immediately shrink the magnitude of revisions. Corrections would become smaller and more frequent rather than massive annual shocks. Smaller, predictable adjustments are harder to spin as partisan manipulation. Yes, QCEW has a couple of months of reporting lag, but those can be shortened with additional staff and faster data processing.
Fix the imputation method. When the BLS publishes the first monthly report, it has to fill in gaps for businesses that haven’t responded yet. Currently, CES imputes these nonrespondents by borrowing growth rates from “similar” establishments, defined by industry and size class. When a small restaurant doesn’t respond to the survey, the BLS imputes its employment data using responses from similar small restaurants that did.
The problem is that “similar” isn’t similar enough. Size classes are coarse: “10–49 employees” lumps together very different businesses. Worse, within each class, the donor pool skews toward larger, more responsive firms with sophisticated HR systems. This means the BLS is effectively applying growth rates from a 40-employee chain restaurant with a dedicated payroll department to estimate employment changes at a 12-employee family diner. These aren’t comparable establishments, and that matters for the quality of the imputation.
The fix is small-domain estimation. Give each industry × size × region cell its own model-based estimate that borrows information across genuinely similar cells, rather than letting big donors dominate the signal from small businesses.
Then there’s the birth-death model, where the biggest distortions live. This is a pure statistical forecast, not real-time data. It estimates jobs created by brand-new businesses not yet in the survey sample, plus jobs lost from businesses that closed before the BLS knew they existed. The model runs on historical patterns of business formation and closure.
Here’s the core problem: big firms are visible immediately, but small firms and startups stay invisible for months. When the economy hits a regime change—pandemic, rate shocks, credit crunch—the model keeps projecting “normal” business formation based on 2018 or 2019 patterns even as reality shifts underneath it. At turning points, this creates systematic bias in predictable directions: (1) during slowdowns, the model overstates job growth by assuming startups that aren’t actually happening; 2) during recoveries, the model understates job growth by missing surges in micro-firm formation.
The transparency fix is straightforward: publish a “no birth-death” companion series every month. Just show what actual survey respondents reported, without the forecast layered on top. Let users see the raw signal before statistical adjustments.
None of these fixes requires Congress to pass legislation or for agencies to undergo major reorganization. They are methodological improvements that the BLS career staff could implement with modest budget increases and leadership buy-in.
The Path Forward
We’ve covered a lot of ground—from how employment data are produced to the political pressures surrounding them. Here’s what often gets lost: the BLS is actually very good at its job. When compared with administrative records, BLS data remain far more accurate than private alternatives. The reforms outlined above require effort to implement, but they build on existing infrastructure rather than starting from scratch. Quarterly benchmarking, small-domain estimation, and greater transparency in the birth-death model are refinements to an already strong system. This period of public scrutiny—uncomfortable as it may be—offers an opportunity to make a good measurement system even better.
 | A guest post by
|