
We Were Right About The 2024 Recession

From 2023 to 2025, there was a lot of talk of a recession. Americans could tell that something was off, but couldn’t prove it, so to speak. This rhetoric became so prevalent that when surveyed, 59% of people thought that we were in a recession, despite the fact that the NBER hadn’t officially declared one. As such, people began to use the term ‘Vibecession’ instead, communicating something ambiguous about the fact that the “vibes were off” in the economy. This begs the question, though: why didn’t economists declare this period to be recessionary? Further, how are recessions even determined, in the first place?
It is often thought that a recession is formally defined as a period of consecutive quarters of GDP decline. This is a myth. It would be nice, perhaps, to have such a clean definition, but it strangely isn’t being used for official classification. So, what is our metric? Since a recession is meant to communicate that the economy is struggling, it stands to reason that the definition would properly account for this.
There is currently no consistent objective measure of a recession. The NBER defines a recession as a period of significant decline in economic activity that is spread across the economy and lasts more than a few months. This is, unfortunately, a bit less quantitative than most people might expect. The standards change over time, and the people who consider what should be introduced to the models change as well. In one year of analysis, non-farm payroll employment might be emphasized, and in another, it could be real income less transfers. Notably, though, these are not holistic, not standardized, and could be reasonably interpreted as being vibes-based.
But what if there was a way to take all of the data we have on historical recessions, standardize the methods they used to determine that these were recessionary periods, and somehow apply this to 2023-2025? What would we find?
Using a model known as a random forest, it is possible to do exactly that. A random forest is a machine learning model designed to do something known as “classification.” This means that you can give it an input data set, and it can determine which category the output dataset should fall into. For our purposes, the random forest is able to take the FRED-MD dataset, which can be found here, and predict, using NBER recession data found here, the probability that there will be a recession within the next twelve months for any given month.
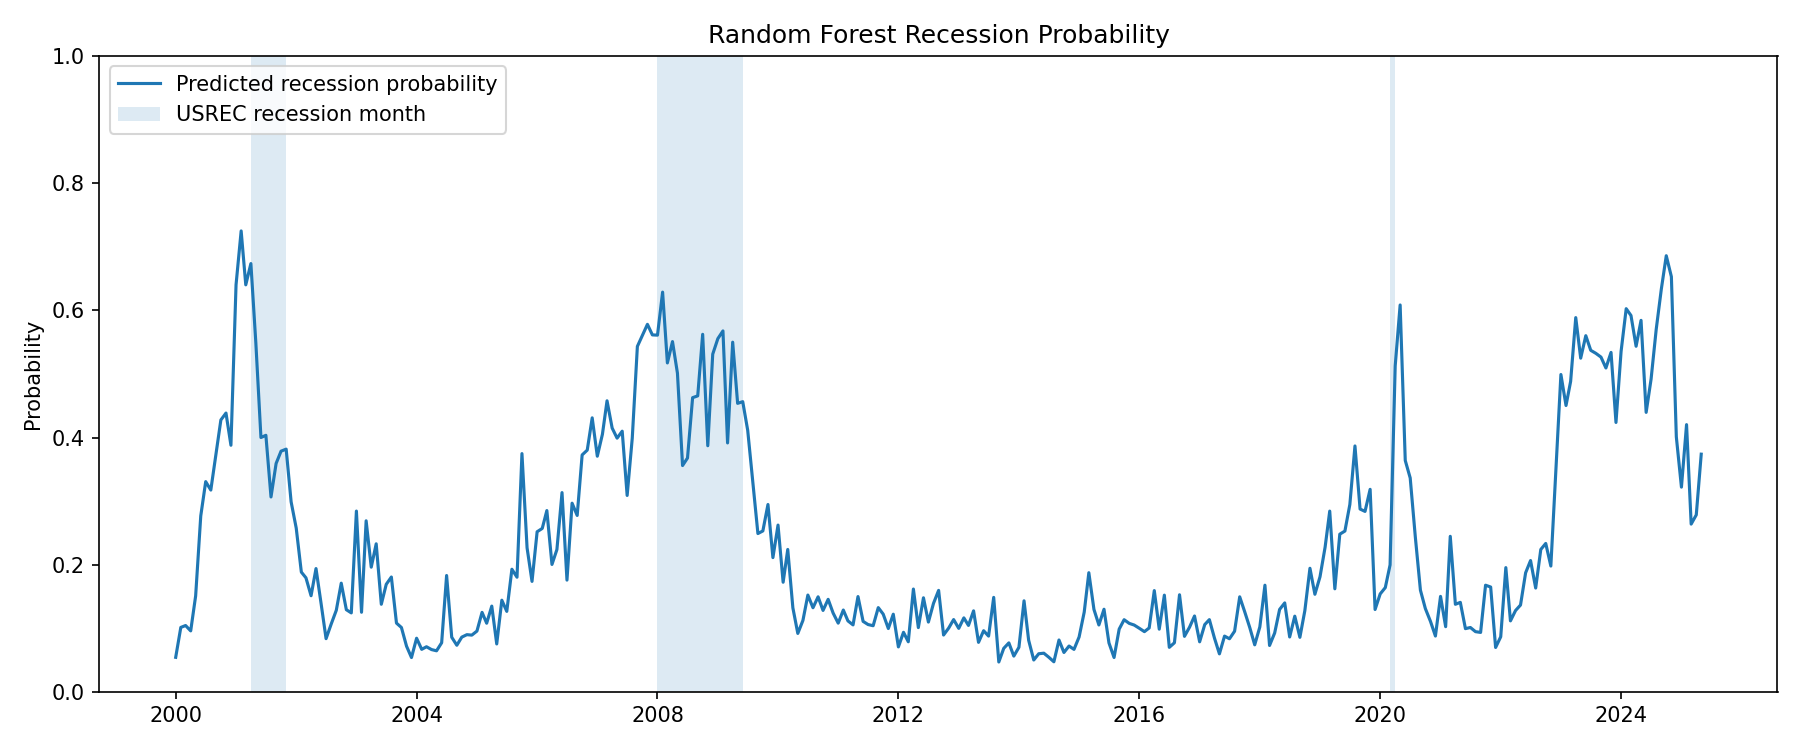
Note for interpretability: this is describing the model’s estimated probability that, given your current month, a recession will occur within the next 12 months; it says nothing about the severity of said recession.
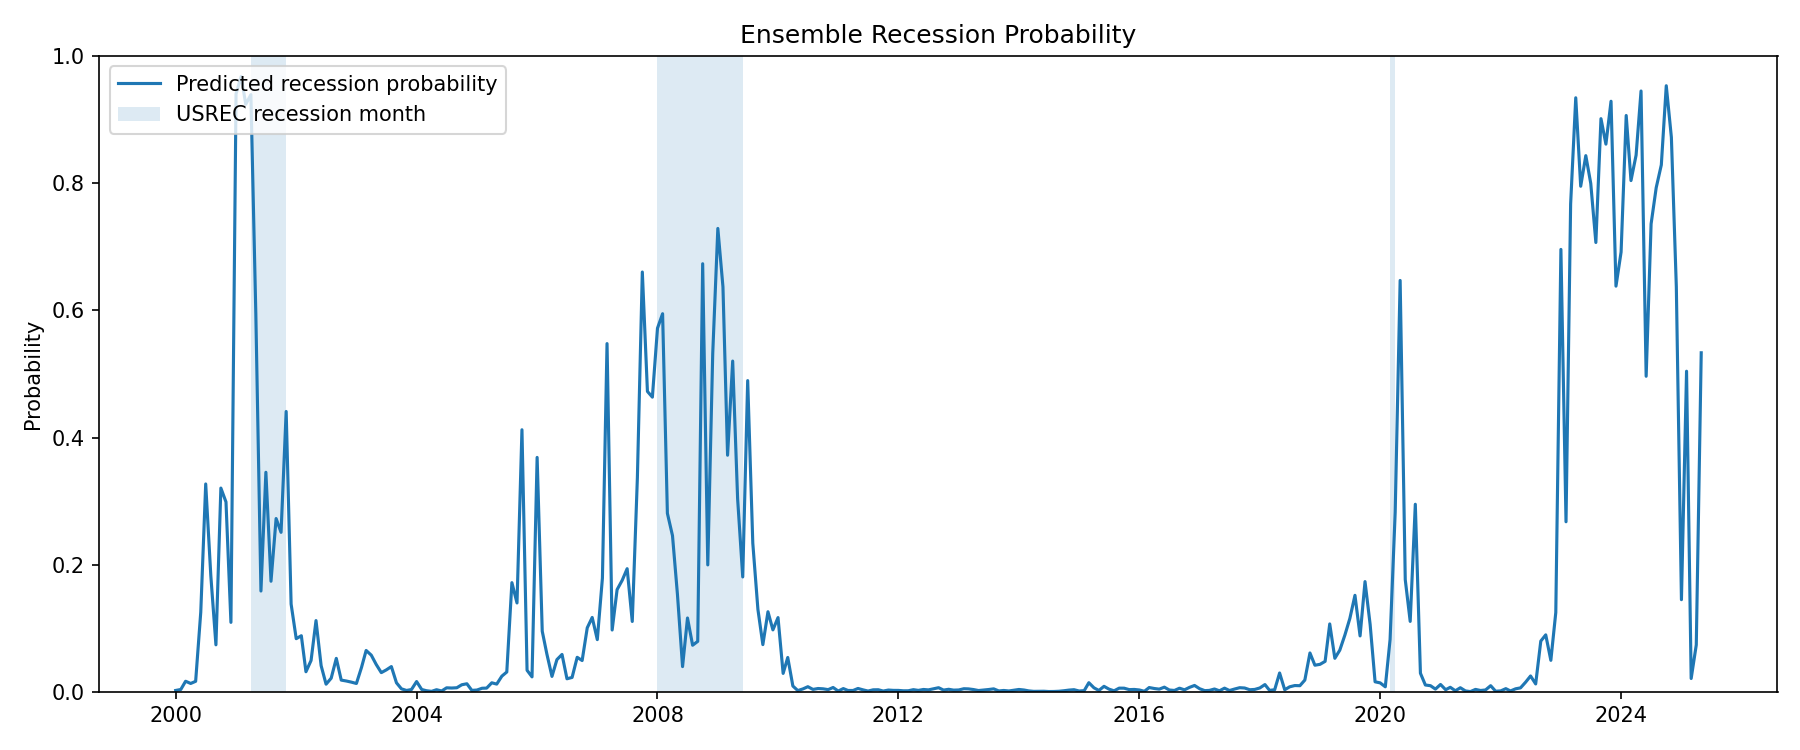
At a glance, this might be compelling enough to determine that 2023-2025 was recessionary. A skeptic might be unconvinced of these data, though. Of course, this one model may not be perfectly accurate, and there is some degree of noise in it. Also, an inquisitive reader might question how the model was trained, citing that this could be the reason for whatever spike we see from 2023 to 2025. These questions are easily resolved, however. For the first point, we can run many different types of models in something called an ensemble, all working on the same classification problem but using slightly different methods. This can be thought of as a sort of “second opinion” on the data. The ensemble data can be seen below, and shows an even starker view of recession probabilities. (For those interested in the technical side of things, see the GitHub repository for this project, which will be linked at the bottom of the post.)
As for the other point, the model is trained on data provided by the NBER’s classification of a recession. In that case, shouldn’t this period be classified as a false positive instead of being evidence that the NBER made a mistake? Why should I trust the NBER in all other cases EXCEPT for the 2023-2025 interval?
The purpose of the model is essentially to determine whether or not the Vibecession should have been classified as a recession according to how we have historically classified them. The model serves as this basis and attempts to provide a more stable framework for recession analysis than the one the NBER is currently using. The model then finds it likely that from 2023-2025, the NBER deviated from its typical recession classification method and provided us with a different analysis than we might have otherwise expected.
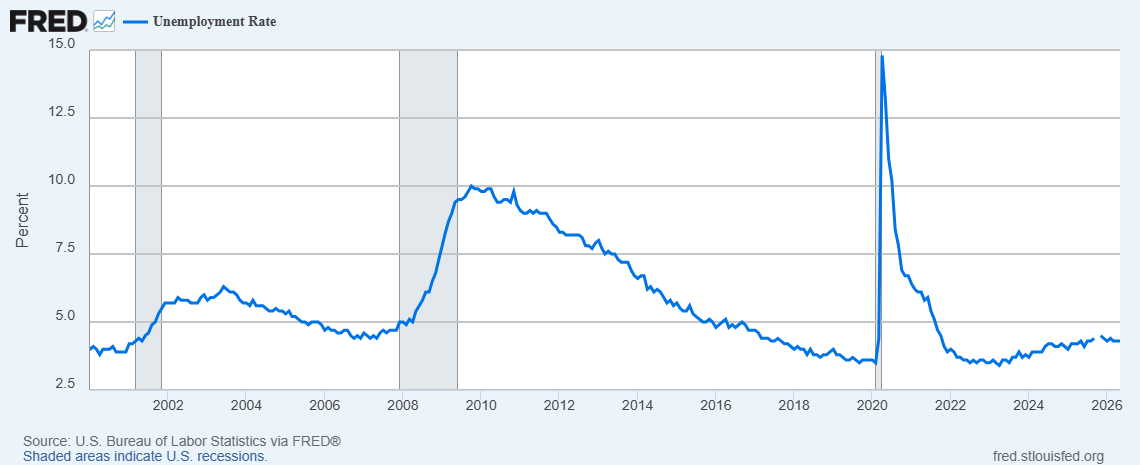
Why did this happen? There are many reasons why the NBER might not declare a recession, but it stems a lot from the behavior of certain indicators. One of these is the labor market, which can be understood in part through unemployment statistics. Economists can talk about job growth, show that the labor market isn’t hurting, and see this as a sign that the economy might not be taking as much of a hit as people think. See below, where high unemployment clearly coincides with officially declared recessions.
In this case, if you were to only analyze the labor market, you would find that 2024 wasn’t a recession. Furthermore, if you were to take this and use it as an indicator for official recessions, it would seem to outperform both the random forest and the ensemble I presented above. Of course, any single indicator is not enough to determine whether or not we are in a recession. Unemployment could be produced as a function of a myriad other variables, correlating with a recession in the way that these input variables for recessions and unemployment tend to be correlated.
So, what do I propose? Clearly, the economy has been hurting recently. Whether you want to label that a recession or not is up to you, but if we neglect to recognize a hurting economy as recessionary, then the term loses meaning. People want a standard metric for recessions: ask almost anyone who might know how a recession is determined. They will tell you that it is two quarters of consecutive GDP decline. At the very least, if the NBER were using this metric, the public could better understand what a recession was. But as it stands, where there is no standard, no metric other than the consensus of economists who are frankly giving just as much onus to vibes as the common man, there is less of a reason to trust the experts. And when the public loses faith in economists, economic arguments hold less and less weight.
I am not claiming that this random forest I presented is perfect or that it should be the standard for recession classifications: what I am saying, though, is that this is a step in the right direction. With machine learning models, we can better understand and analyze data, frame problems in a more empirical way to better determine what exactly economic pain is, and create a framework that can better reflect common consensus when it comes to recessions. More so, I want to move in the direction of having a recession classification framework that is consistent, quantitative, and easily understood.
Here is a link to the model and the data I used, in case you wish to replicate my results.
Great analysis. Economics seems like untapped territory for ML models and the like. As a data scientist I'm looking forward to seeing what other applications you find!
Thanks for sharing! As you know, I've been talking about this for a while but didn't have the data to support my hypothesis. Well done!