
When a Chart Tells Half the Story
What the Times Left Out of Its Soybean Export Story

Tariffs have taken a clear toll on U.S. exports, including for crops like soybeans. There are many ways to illustrate this reality. Unfortunately, The New York Times’ recent attempt fell short. Instead of clarifying the damage, the article led with a chart that seems to conflate seasonal patterns with tariff effects.
Last week, the Times reported on the sharp decline in U.S. soybean exports to China, correctly noting that retaliatory tariffs have driven up costs and reduced demand. But the story’s opening graphic risks misleading readers by implying that normal seasonal swings are evidence of tariff impacts.
For reference, here is the chart that the Times correspondent used:
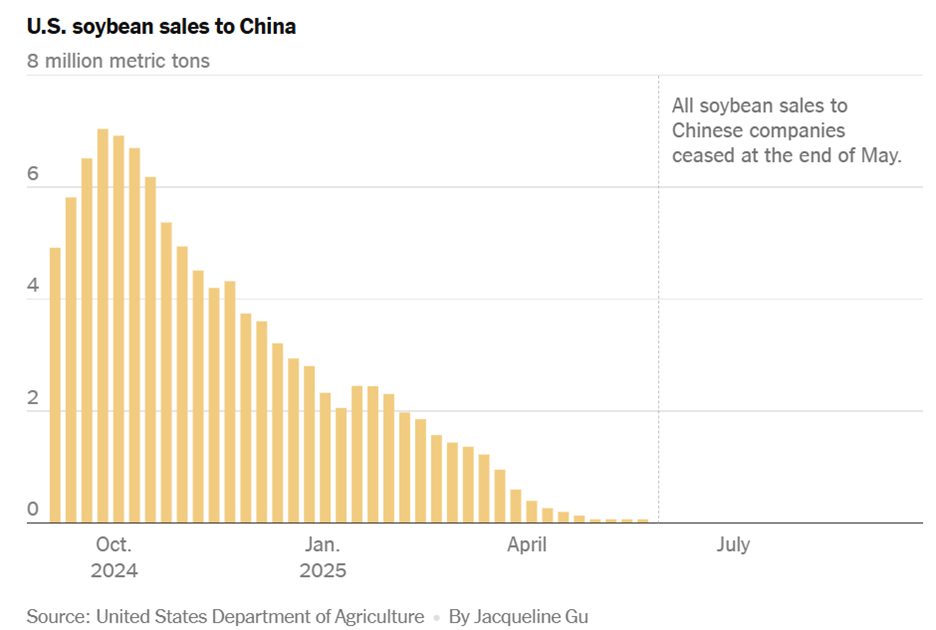
Reviewing this chart, a typical reader might be quick to conclude that the sharp downtrend in soybean exports to China is entirely the result of restrictive trade policies. Just to be clear, I have no doubt that restrictive trade policies are playing a role here, not to mention the massive welfare losses of such policies.
The chart used to make this point is still misleading, however. Data can be cherry-picked, and timelines can be narrowed or tailored to corroborate a broader point that a commentator is attempting to make. In this instance, The New York Times starts its visual analysis from peak harvest export season and ends during a time of year when soybean exports are at their lowest. In other words, most of the decline seen is seasonal.
To highlight this point, I found the U.S. Department of Agriculture data used in this chart (outstanding sales) and extrapolated the data back three more years to 2021. As you can now see in the chart below, the spikes in the fall and the lulls in the summer are largely seasonal as U.S. soybeans are harvested from late September through October.
Another way to observe trends in soybean exports is to review new gross sales, rather than outstanding sales. New sales reflect fresh buying interest from importers in that specific week. If we want to know whether China is actively buying now, new sales might give the answer, while outstanding sales might just show contracts that were signed before the trade dispute escalated.
Again, here we see that trends are largely seasonal. However, both charts do show that the lull this summer is lower than in prior years, and as the Times piece notes, it has now dropped to zero.
The trade war is undoubtedly having a negative impact on U.S. soybean exports to China. Compared with last year, the U.S. has about 40% fewer outstanding sales and 12% fewer new sales of soybeans to China through the end of August. But the chart used in the article is still misleading, as the trend it shows is mostly seasonal variation without context.
No one should downplay the real harm caused by protectionist policies. At the same time, the way we present data matters. Charts and graphics are powerful tools for shaping public understanding, but when they are selectively framed, they risk distorting more than they reveal.
Seasonal cycles, alternative measures and longer historical baselines all provide necessary context for drawing meaningful conclusions. If commentators aim to inform rather than simply persuade, they must present the full picture, even when it complicates the narrative.
Thanks for correcting that.