
Have Surtaxes and Tax Increases on High Earners Led to More Income Tax Revenues?
Revisiting Tax Changes in New York and Massachusetts

There has been a wave of high-spending states imposing additional surtaxes, capital gains, and higher marginal tax rates on high earning residents. In every state, the argument for such additional taxes is to fill budget gaps and fund new spending initiatives. Yet, a careful analysis of income tax revenues suggests that these taxes are not leading to the revenue windfall that state policymakers often promise.
The Governor of Maine recently signed into law a budget that includes a 2 percent surcharge on income over $1 million. This comes just weeks after Washington state imposed a 9.9 percent tax on income above $1 million. Other states such as Minnesota and Maryland have imposed additional capital gains surtaxes on high earners in recent years.
Many blue states now have top marginal income tax rates (combined federal, state, local, FICA, and NIIT) that are above 50 percent, and this list looks set to grow further.
To test whether additional state taxes on high earners notably increase state tax revenues, we can observe the revenue trends of two states that have imposed millionaire taxes in recent years: New York and Massachusetts.
In 2021, then-New York governor Andrew Cuomo, raised the state’s top marginal tax rate on earners making over $1 million to 9.65 percent from 8.82 percent. He also introduced two new brackets for those earning over $5 million and $25 million, with a top rate of 10.9 percent. In New York City, taxpayers also have to pay the 3.9 percent city income tax, for a top combined state and city rate of 14.8 percent.
Two years later in 2023 Massachusetts imposed a new 4 % surtax on incomes over $1 million added to its existing 5 percent flat tax (for a top rate of 9 percent). Voters approved this measure via referendum in 2022, and politicians promised a surge of new revenues.
To remove the distortion of rising prices, the first metric to review is real income tax revenues. Using a CPI deflator, the two bar charts below show changes in revenues over time in 2018 dollars. The red dashed line shows the level of revenue in the year before the new tax was implemented. Green bars are real revenues before the tax change and orange bars show real revenues after the tax change.
In New York, after raising tax rates on high earners in 2021 real revenues seem to spike in 2022 before falling below pre-tax reform levels in the 2023-25 period. In contrast, Massachusetts saw an immediate drop in real revenues the year the tax first applied (2023) before slowly recovering to pre-reform levels by 2025. Neither trend demonstrates a notable upswing in income tax revenues that we might expect to see from the windfall policymakers often promise.
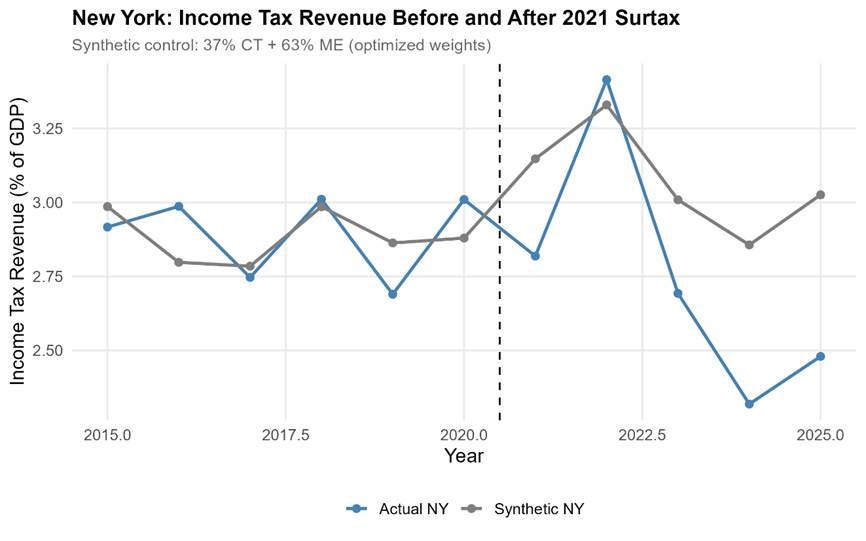
An alternative way of measuring changes in income tax revenues over this period is to observe how revenues as a share of state gross domestic product change (GDP) over time. The first line chart below shows this for New York. The orange dashed line shows the average income tax revenue to GDP in the pre-reform period. Like the bar charts above, we see a spike in 2022, but then 2023-25 revenues are notably below pre-reform levels.
The grey shaded area shows the post-reform period.
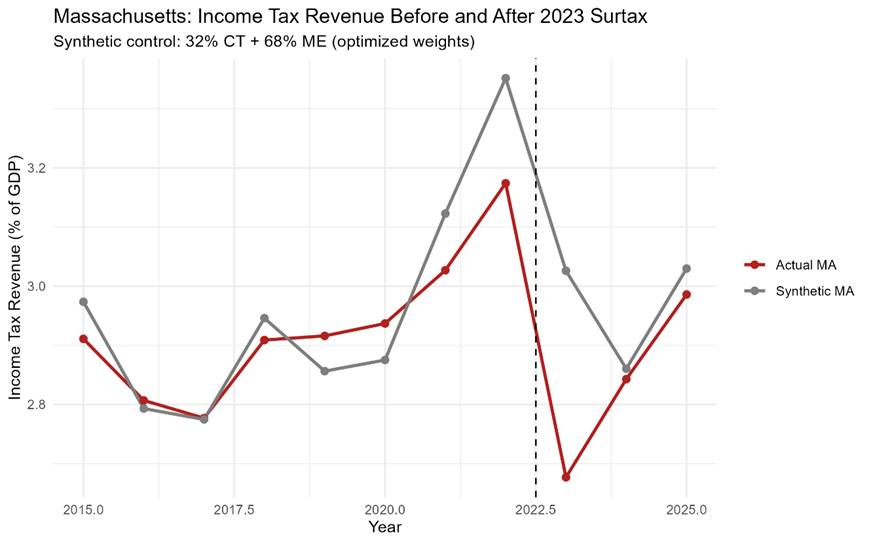
The second line chart below shows the same metric for Massachusetts. In this case, we see an immediate drop in revenues in the first year that the millionaire tax applied before recovering to pre-reform levels by 2025.
To move beyond simple before-and-after comparisons, we can construct a counterfactual for each state using a synthetic control approach. The idea is straightforward: instead of asking whether revenues rose or fell in isolation, we ask how they performed relative to a “synthetic” version of the state built from similar states in the region that did not adopt surtaxes. In this case, Connecticut and Maine serve as donor states, with weights chosen to minimize pre-reform differences in income tax revenue as a share of GDP.
When these weights are optimized to best match pre-treatment trends, the synthetic controls track both New York and Massachusetts reasonably closely prior to their respective policy changes. This gives some confidence that the post-reform divergence is informative. After New York’s 2021 tax increase, its revenue-to-GDP ratio falls persistently below its synthetic counterpart. Averaging over 2021–2025, New York collects about 0.33 percentage points of GDP less in income tax revenue than its counterfactual benchmark would predict.
Massachusetts shows a similar, though more muted, pattern. Following the 2023 surtax, revenues initially drop below the synthetic control and only partially recover. Over 2023–2025, Massachusetts collects roughly 0.14 percentage points of GDP less than its synthetic benchmark.
In both cases, the direction of the gap runs counter to the “windfall” narrative often used to justify these policies. While this is a simplified exercise, using a limited donor pool and not a full formal synthetic control, it reinforces the broader pattern: higher marginal tax rates on top earners have not translated into sustained gains in revenue relative to underlying economic activity.
The best recent quasi-experimental evidence from California’s 2012 tax hike shows just how quickly high earners adjust. Rauh and Shyu (2024) find that nearly half of the projected revenue gain disappeared within a year, and over 60 percent within two years, driven primarily by behavioral responses among those who stayed, not just by out-migration. Estimated elasticities of 2.5–3.2 imply that high-income taxpayers are extremely responsive to marginal tax rates, making static revenue estimates deeply misleading.
Once we account for the full set of avoidance and adjustment margins: income shifting across tax bases, changes in organizational form, and intertemporal timing, the tax base becomes far more elastic than naive models assume. The result is a much flatter Laffer curve: tax rate changes have only modest effects on revenue. In the most realistic calibrations, the revenue-maximizing top rate is close to 40 percent (combined). Notably, several high-tax states already impose combined federal, state, and local top marginal rates at or above this level, exceeding 50 percent in some cases, suggesting that further rate increases are especially unlikely to generate meaningful additional revenue.
One notable behavioral response that state policymakers often overlook is that state residents can vote with their feet and take their income with them. The charts below show the net migration of high earners in both New York and Massachusetts during the 2018-2023 period. High earners in this case are defined as individuals making more than $200,000 a year. New York lost, on net, 176,000 high earners in 5 years who took $50 billion of income with them. Massachusetts lost 33,000 high earners and $9.3 billion in income.
When a small number of high-income taxpayers account for a disproportionate share of the tax base, even modest net outflows can materially erode expected revenues. This helps explain why the revenue effects of higher top marginal tax rates often fall short of projections.
The evidence from New York and Massachusetts provides no support for the claim that higher marginal tax rates on top earners generate large and sustained revenue gains. In both states, the initial promise was straightforward: raise rates on a narrow group of high-income taxpayers and use the proceeds to finance new spending. Yet the data tell a more complicated story. Real revenues are volatile and, in both cases, fail to show a clear and lasting increase after the policy change. When measured relative to state economic output, the picture is even less favorable, with revenues either falling below prior levels or underperforming reasonable counterfactual benchmarks.
Imposing additional surtaxes on high earners may be politically appealing, but the data and evidence suggests that this tax base is too mobile and too responsive to deliver the revenue windfalls that policymakers often promise. If these policies do not reliably generate additional revenue, it raises an obvious question about their primary objective.
The rich are entirely capable of adjusting to increased taxes--and they do. In the 1960s, Great Britain had a top marginal tax rate on income above $1 millio9n of 99%. Revenues at that rate were - zero. Some adjusted by moving -- that's why The Beatles came to N ew York City. Others found multiple ways to show no earned income above the top rate. Some simply stopped doing things that generated income they'[d just have to turn over to the government.
The only people who are forced to pay higher taxes are the middle class. WEho are easily fooled by claims to the contrary. Watch Californiain the upcoming election.
So if the middle class, with ai, get "savvy" like the ultra rich in obfuscating tax law and make their tax obligations go poof the government should not raise or bother taxing them as well?