

Transparently Untransparent: A Review of Iowa’s FY 25 Annual Urban Renewal Report
In my previous post, I defined tax increment financing (TIF) and answered frequently asked questions about TIF. If you are unfamiliar with the policy, feel free to check out that piece first. In this post, I will use Iowa as a case study to examine one state’s TIF policy.
My critique of widespread TIF rests on three key arguments.
First, governments face an information problem. Local officials cannot reliably determine which projects would occur without subsidies or accurately predict future property value growth decades into the future. As a result, TIF often produces long-term debt obligations based on optimistic assumptions that may never materialize.
Second, TIF has expanded far beyond its original purpose. Rather than primarily financing public infrastructure that addresses genuine market failures, many TIF districts subsidize commercial buildings, residential developments, hotels, and other projects that private investors would ordinarily finance themselves. This broad use of subsidies increases the risk of political favoritism, rent-seeking, and the misallocation of taxpayer resources.
Third, TIF operates with insufficient transparency. Most states provide little or no comprehensive reporting on TIF districts, making it difficult for taxpayers, policymakers, and economists to evaluate whether projects satisfy statutory requirements or produce meaningful public benefits. Without reliable data, it is nearly impossible to measure TIF’s effectiveness or hold local governments accountable for diverting future property tax revenue.
Luckily for me, the state with the most TIF districts — a total of 4,260 urban renewal districts as of 2025 — is also one of the few that produces a comprehensive annual report. And while the Iowa 2025 Annual Urban Renewal Report is only 20 pages long, it contains statistics and admissions that paint a remarkably different picture of how TIF operates in practice.
TIF isn’t mostly funding infrastructure
TIF is supposed to work as a funding mechanism for public infrastructure that private companies would not provide. In Iowa, however, of $368.4 million in FY 2025 nonrebate TIF expenditures, only 44.3% went toward roads, bridges, and utilities. The remaining 55.7% financed other activities, including commercial buildings, industrial projects, property acquisition, recreation facilities, residential development, administrative expenses, and public buildings. This is shown in table 1 below.
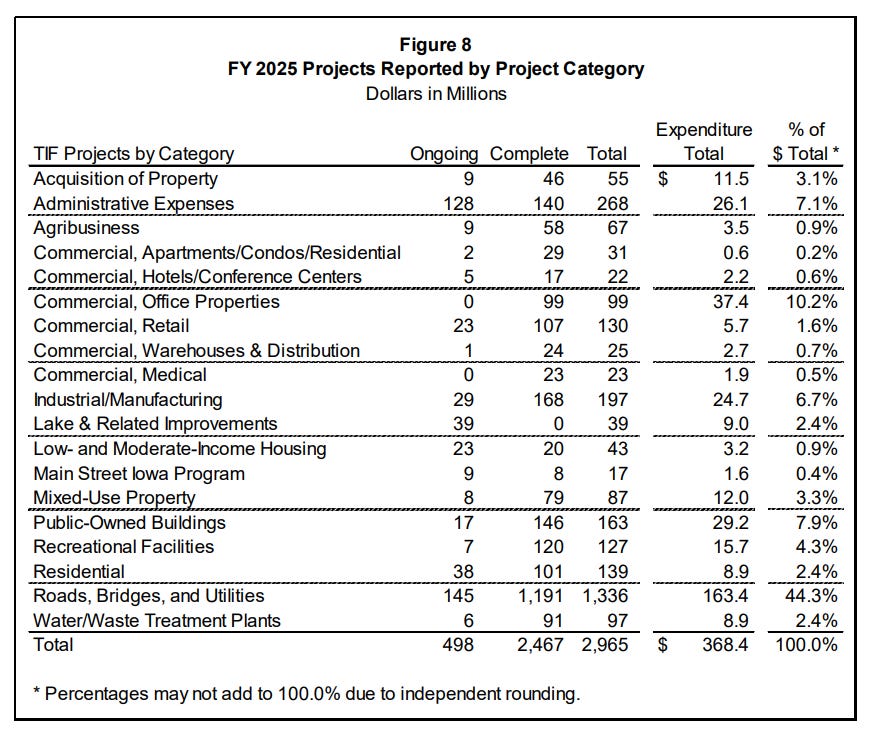
These data undermine the argument that TIF primarily exists to finance public infrastructure that enables private investment. Rather than simply providing the infrastructure private developers need, TIF increasingly subsidizes the developments themselves. This distinction matters because infrastructure improvements are meant to help the public at large, making the use of tax revenue to finance them easier to justify. In contrast, subsidizing individual developments shifts the costs from developers and forces taxpayers to fund projects from which they may never benefit.
The debt is much larger than expected
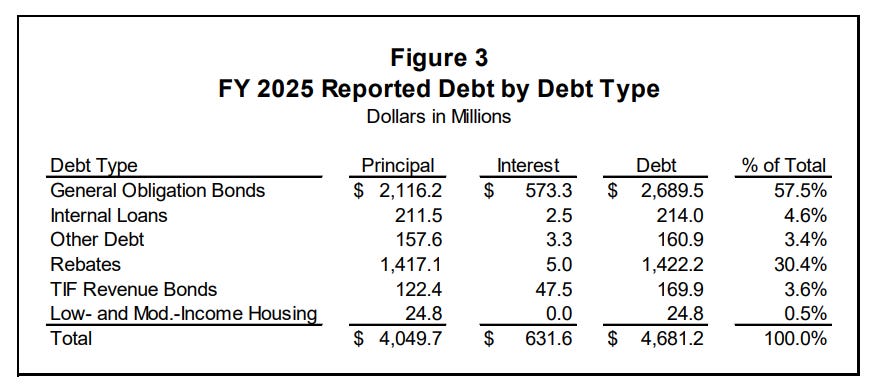
Another notable finding in the report is the sheer level of outstanding TIF debt held by local governments. Table 2 shows that municipalities reported $4.681 billion in debt that they expect to repay with future TIF revenue — an amount equal to 9.8 years of current TIF property tax collections.
Included in the debt are over $600 million in interest payments. The fact that the policy creates billions of dollars in debt that rely on external forces such as economic stability and consistent growth undermines the claim that TIF is self-financing. If the future growth in property values that TIF depends on fails to materialize — which can happen for many reasons — those obligations become much more difficult to service.
And these debt obligations matter, because TIF districts are financed by capturing future growth in property tax revenue that would normally go to cities, counties, school districts, and other taxing jurisdictions. Until the debt is repaid, the incremental revenue will continue to be diverted to a special TIF fund rather than being available for public services.
Many TIF districts are based on 20–30-year debt payment schedules. The report states that “local governments reported 940 separate general obligation bond debts, with debt payments totaling $2.690 billion with the longest payment schedule extending through FY 2050.” Decades-long debt repayments that rely on property value growth in order to be repaid are vulnerable to several extrinsic circumstances. Economic downturns, natural disasters, or simply slower-than-expected economic growth can all leave districts financially underwater. This is why debt financing is the riskiest way to implement TIF.
By allowing municipalities to borrow against uncertain future property tax growth, debt-financing TIF encourages both local governments and developers to pursue projects they might not otherwise undertake while shifting much of the financial risk onto taxpayers.
Debt financing, however, is not the only way TIF districts are funded. Under a pay-as-you-go TIF arrangement, local governments do not issue bonds or make large upfront payments to developers. Instead, developers typically finance the project themselves and are reimbursed over time as the project generates new property tax increment.
This approach avoids public borrowing while still redirecting future property tax growth to the project rather than to general government purposes during the life of the TIF district. While this method encourages more responsibility, it still imposes a burden on other local taxing jurisdictions.
Proponents argue that TIF does not harm public services because cities, counties, and school districts continue to receive property taxes on the original, or “base,” value of the property. Since these governments operated before the TIF district was created, the argument goes, they can continue operating with that same revenue while the incremental tax growth pays for redevelopment.
But this overlooks the very premise of TIF.
If the policy succeeds in attracting new residents, businesses, and investment, it also increases demand for public services. More homes and businesses require additional police and fire protection, road maintenance, inspections, and other local services. Yet the additional property tax revenue generated by that growth is diverted into the TIF fund rather than flowing to the governments responsible for providing those services.
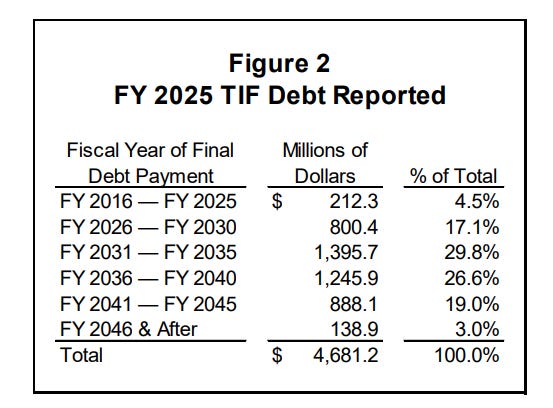
As a result, local governments face higher service demands without receiving the corresponding increase in tax revenue until the TIF obligations are retired. Meanwhile, municipalities continue adding new TIF obligations before existing ones have expired.
This is reflected in the figure below. The debt payment schedule is set decades out with no indication that additional debt will not just pile onto the existing billions.
California dealt with a similar problem after 50 years of widespread TIF policy. In 2012, the state was facing a major debt crisis caused in part by tens of billions of dollars in outstanding TIF debt and obligations. To alleviate some of this debt, Governor Jerry Brown chose to dissolve the program.
California has since resumed TIF policy, but in a much more restricted way that disallows any funding diversion from school districts. If Iowa doesn’t change course and rein in TIF spending, it will likely reach a breaking point like California’s, in which they have the default on their books.
Iowa can’t fully account for its TIF districts
Continuing further into the Iowa report, there is a section labeled “Identified Problems with the Reporting Process.” This section highlights one of the biggest problems associated with TIF across the country: the complete lack of transparency.
The section begins by noting that some local governments do not submit their required annual TIF reports on time. Some didn’t even submit one at all. And of those that did submit reports, many failed to adhere to the designation requirements set by law.
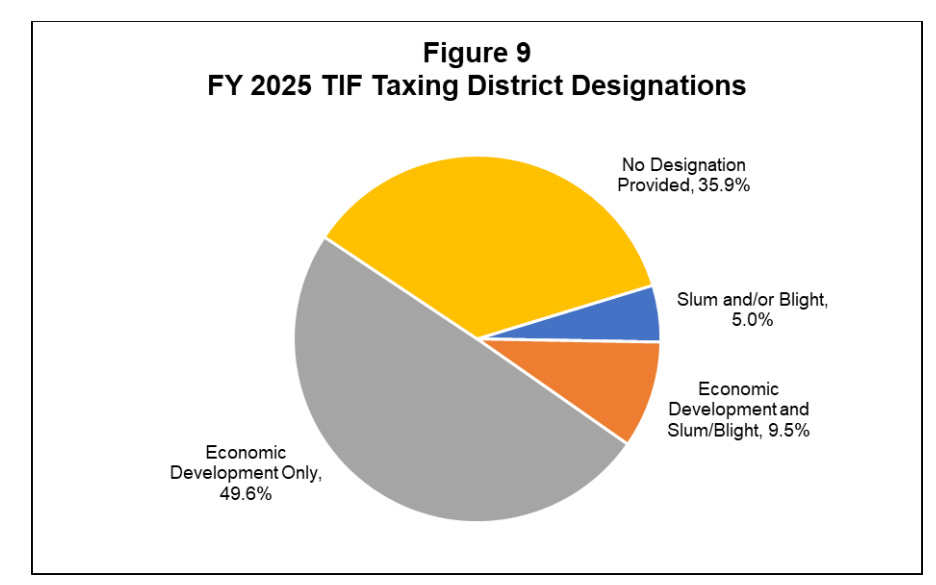
Local governments are required to report whether each TIF district was created based on findings of slum conditions, blight, economic development, or some combination of those purposes. This is shown in the figure above. Yet 35.9% of Iowa’s TIF districts failed to report any designation in the statewide database. Those undesignated districts nevertheless accounted for approximately $4.0 billion in TIF increment value during FY 2025. While this does not necessarily mean the districts were created unlawfully, it prevents taxpayers from verifying whether the statutory basis for the districts was properly established.
If Iowa is transparent, what are the other 47 states hiding?
This lack of transparency and compliance is troubling, but Iowa is still ahead of most states. At least it publishes a statewide report that makes these shortcomings visible. In contrast, 47 states (excluding Iowa, Nebraska, and Alaska) provide no comparable statewide urban renewal or TIF report, leaving taxpayers, researchers, and policymakers with little ability to evaluate how TIF is being used or whether local governments are complying with state law.
We should demand transparency if only because it is the law. But there are also plenty of practical reasons why more transparency will help both sides of the TIF debate.
Having clear reports that allow us to analyze the effectiveness of TIF in both intrastate and interstate contexts would help policymakers better understand the implications of tax increment financing. Without complete reporting, taxpayers cannot determine whether TIF districts satisfy statutory eligibility requirements, whether promised public benefits materialized, or whether governments are complying with legal restrictions on TIF use.
Iowa deserves credit for publishing one of the nation’s most comprehensive TIF databases. Ironically, that transparency also shows how difficult it is to monitor the program. If one of the country’s best reporting systems still reveals billions of dollars in outstanding debt, widespread reporting deficiencies, and extensive use of TIF beyond traditional infrastructure, taxpayers should question what remains hidden in the dozens of states that provide no comparable statewide reporting at all.
